
Graphs, geometry and function curves in Word
A maths worksheet is judged on whether the curve is the right shape and whether the angle really is the angle you labelled - so the drawing has to be exact and still be part of the document your class is reading. Both are possible when the figures are vector shapes rather than pictures.
Exactness is the whole point
Hand-drawn geometry is a compromise: a "right angle" that is 88 degrees teaches the wrong thing to a class that is measuring. The geometry figures in the library are generated from the geometry itself, so an angle of 37 degrees is 37 degrees, a tangent touches, and a circle is a circle.
Function curves are generated the same way, which is what makes them useful for explaining shape: insert y = x², then copy it and change the exponent to compare the curves side by side in the same axes.
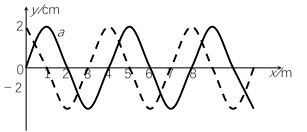
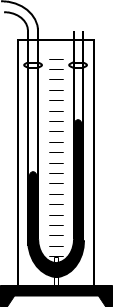
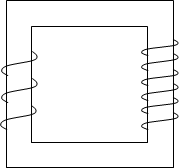
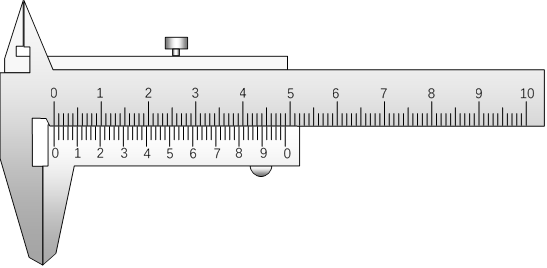
What the mathematics library covers
Graphs and functions
Axes you can label, curves for the functions your syllabus names, and the transformations that go with them - the same figure with the coefficient changed, rather than a new drawing.
Geometry
Angles, triangles, quadrilaterals, circles, tangents, and the constructions that have to look exact: bisectors, perpendiculars, parallel lines, circle theorems.
Coordinate work
Grids, gradient triangles, midpoints, straight-line graphs and the diagrams that make "find the equation of the line" answerable.
Trigonometry and shapes
Right-angled triangles with labelled sides, the unit circle, sine and cosine curves, and the 3D solids that are usually drawn as a compromise.
Working with graphs and figures
Insert the axes, then the curve
Axes first, so the curve can be positioned against them rather than the other way round. Both arrive as shapes, so your own tick labels and units fit the way you want them.
Copy the figure for a comparison
Insert y = x², copy it, and change the exponent for the second curve in the same axes. Two curves side by side teach the shape better than two separate pictures.
Keep the exactness
Do not resize a single line to make a figure fit - scale the whole group. That way the 37° angle stays 37° and the tangent still touches the circle.
Label for the class copy
Add the labels for your master, then delete the text boxes to make the worksheet version the class fills in. It is four deletes, not a redraw.
Print it, do not screenshot it
Vector shapes print sharply and export to PDF without turning into pixels. The same figure serves the worksheet, the slides and the end-of-term test.
Drawings carry alt text, so a figure you insert can be described to a screen reader and checked by accessibility tools - useful when a school publishes materials online.
Exact figures, 7 days, no card
Install it and put this week's topic on the page - the angle will be the angle you asked for.